
Getting started: investing in the energy transition ⚡🐂📈
A look at a few companies that are doing big things (that we also invest in)

Dear Partners,
As the world watched last week, millions of people in Texas lost power during the coldest weather experienced in the state in decades. During this disaster, there were attempts at political point-scoring, including Governor Greg Abbott claiming that wind turbines and the ‘green new deal’ are responsible. This comes despite the Texas grid operator saying that fossil fuel generation had failed at twice the rate of renewables during the winter storm, combined with the fact that fossil-based generation makes up the vast majority of the state’s power supply.
As shown below, the independently operated Texas electricity grid is powered by primarily fossil fuels, with only around 25% of the total coming from renewables.
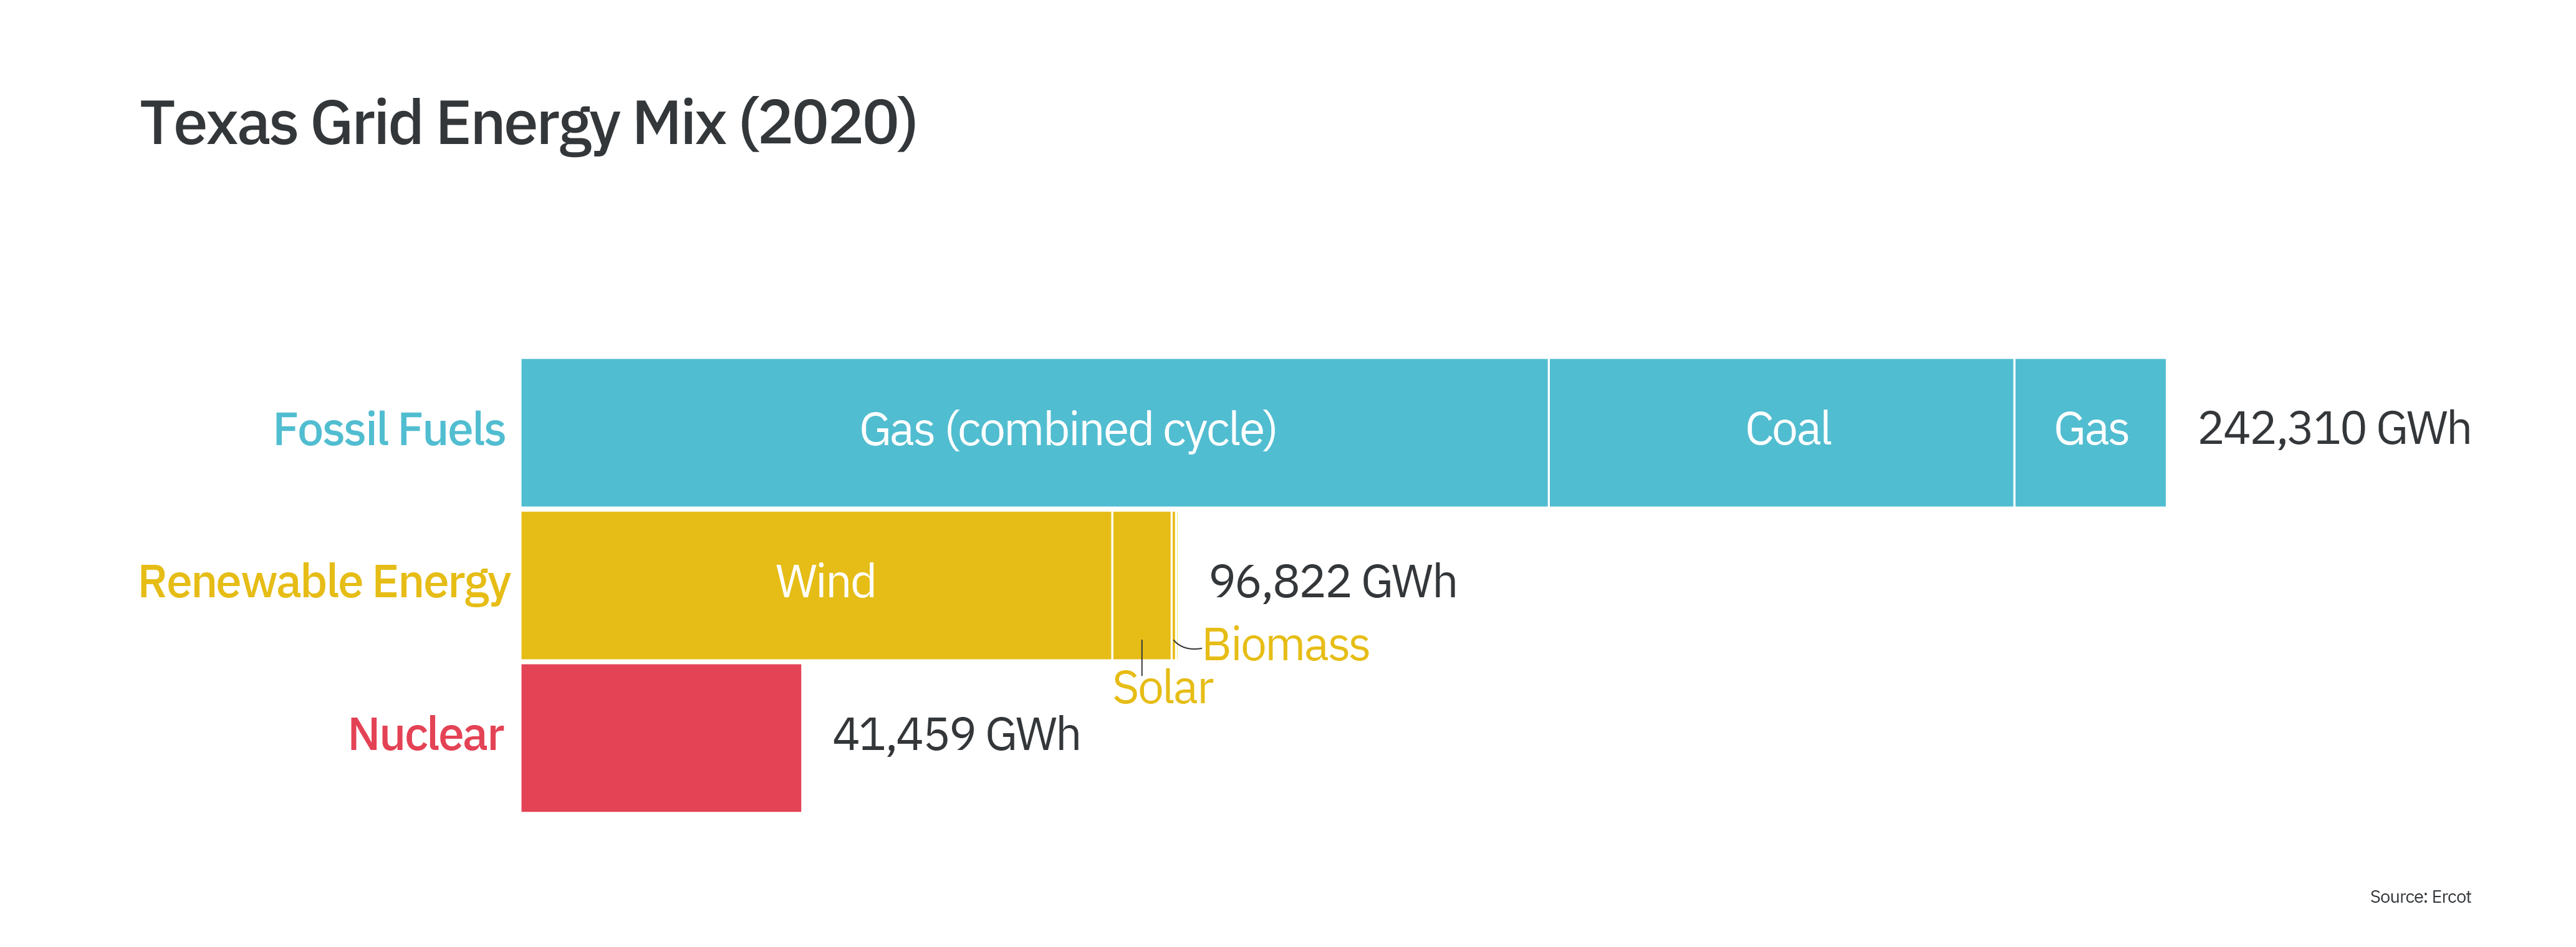
In reality, it was a complex mix of factors that caused the widespread blackouts. A general lack of preparedness for low temperatures was the common thread across the network. This was exacerbated by the limitations of the Texas grid which is deregulated and operated independently from the rest of the USA, therefore leaving it unable to import energy during times of need.
What has been lost in this saga is the fact that renewable electricity generation has been a massive success for the state of Texas. The state has the highest number of wind-energy jobs in the US and according to Bloomberg, the renewable energy sector has been the second-fastest-growing source of new jobs in the US over the past two years, following only the explosive growth of e-commerce.
While climate change and clean energy are often discussed during events like the recent Texan storm, what is often overlooked is the huge opportunity that the transformation of energy systems presents to businesses and investors. We are here to help investors better understand the energy transition, and how to position their portfolios to take advantage.
SAIP ⚡ Holdings
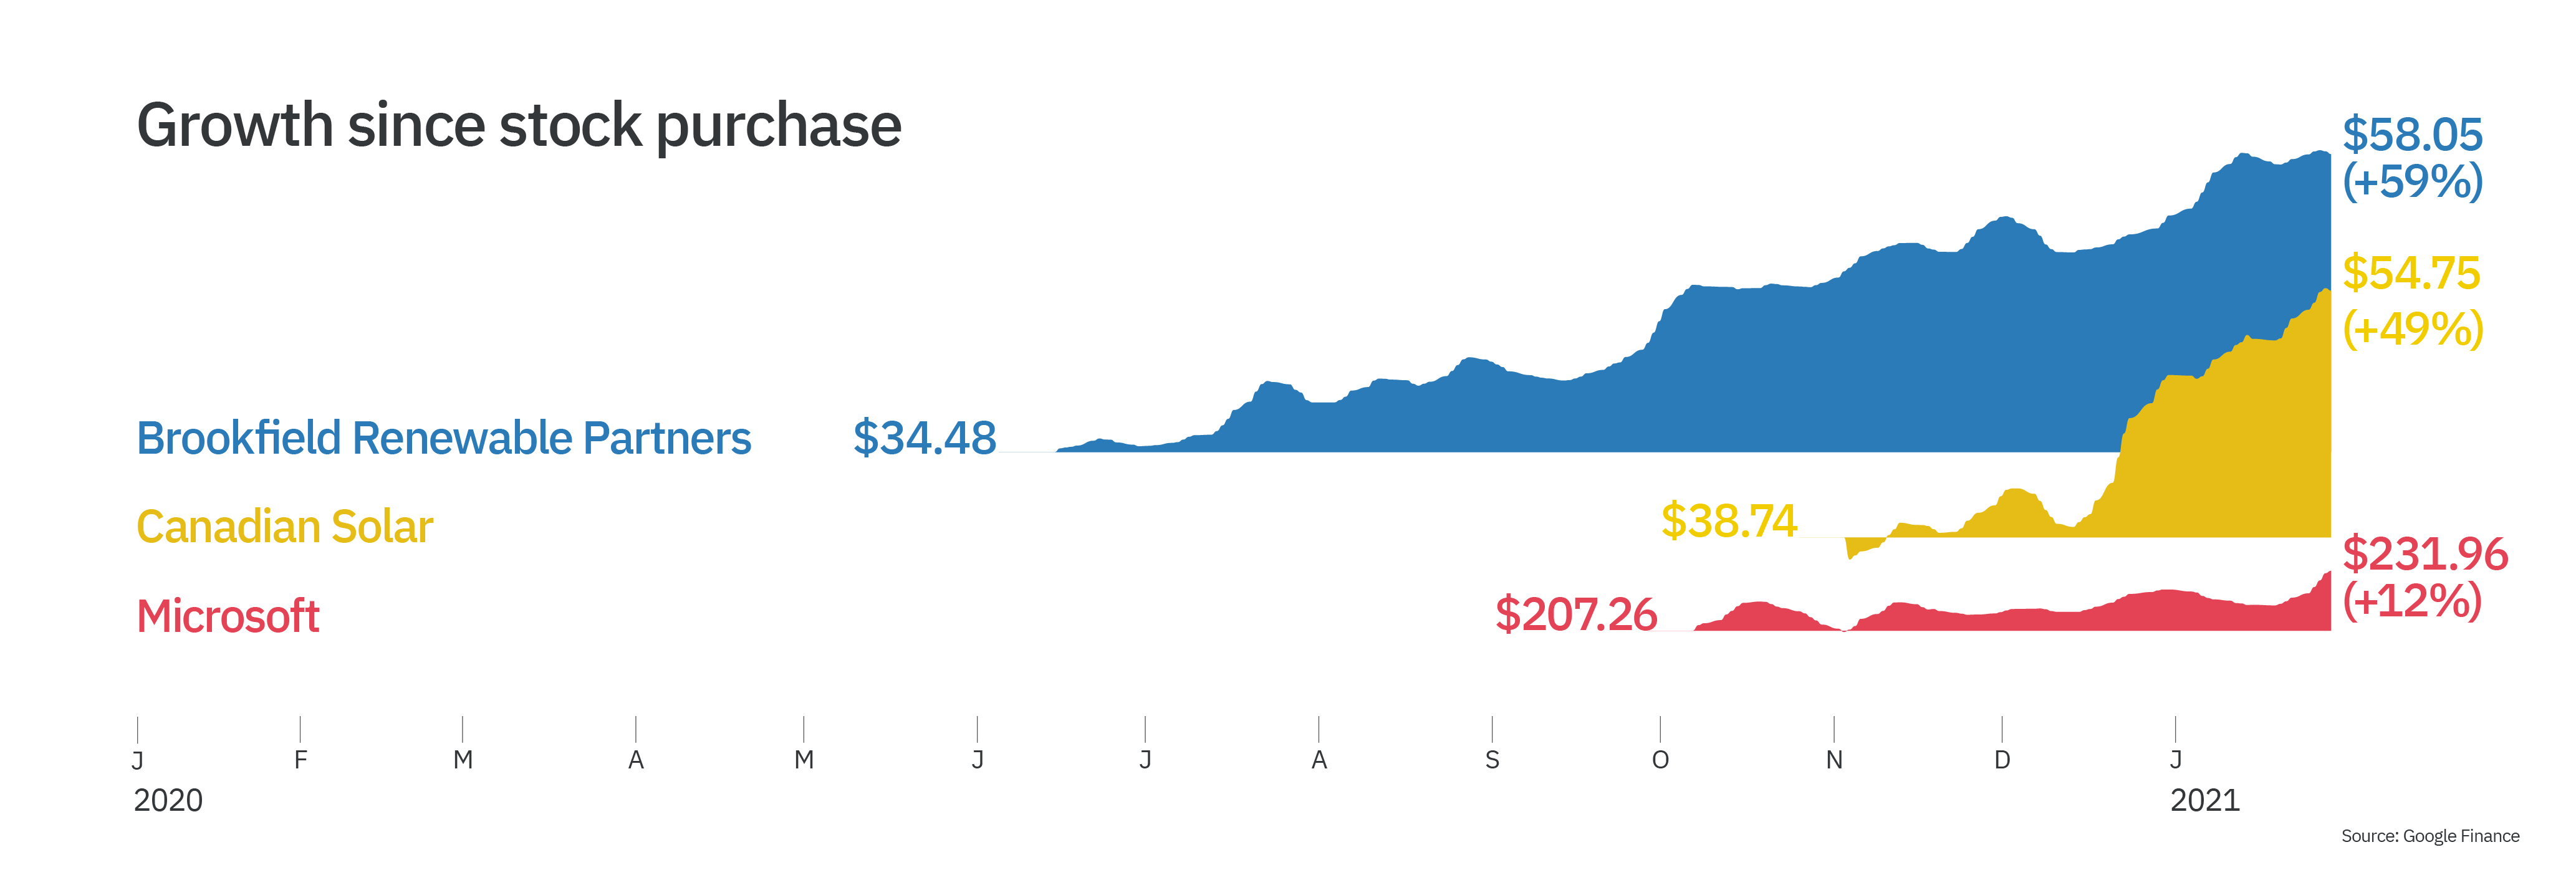
This week, we will discuss three of our holdings:
The chart below shows the growth of each of these stocks since the date we’ve purchased them.
Brookfield Renewable Partners LP (TSX: BEP.UN)
Where to begin with Brookfield Renewable? This Canadian firm has long been among SAIP’s top holdings.
Brookfield Renewable has also been among the highest performing holdings in the SAIP portfolio, growing 59% since purchase on June 5th, 2020. The company has consistently been able to deploy capital to renewable energy and infrastructure projects around the world at high rates of return and has a world-class management team working under CEO Bruce Flatt (aka Canada’s Warren Buffett).
Parent company Brookfield Asset Management has $600 billion of assets under management and is focused on owning and operating real assets around the world. A core division of the company is Brookfield Renewable Partners, which owns and operates 5,300 renewable generation facilities in North America, South America, Europe, and Asia.
Brookfield has diversified interests across hydro, solar, wind, and energy storage, and the company projects that it will continue to grow free cash flows by 11-15% annually through 2025.
Attractive elements of the company and its strategy include a top-tier balance sheet, a large pipeline of new projects coming online (23 gigawatts), and long-term contracts for the power that it sells. Additionally, the company pays a 4.3% dividend yield and projects that it will continue to grow the dividend at a rate of 5-9% annually going forward.
What’s not to like?
Canadian Solar Inc. (NASDAQ: CSIQ)
The Canada-headquartered and Chinese-owned Canadian Solar is a manufacturer of solar photovoltaic (PV) panels and operates large-scale solar energy projects globally.
The company has had a terrific annual compound growth rate over the past decade averaging approximately 18%. In addition, the company is trading at a price-to-earnings (PE) ratio of 17 which signifies that it is among the best value solar stocks when compared with its peers. Since the huge run-up in the price of solar stocks during 2020, many companies in the space are trading at high prices relative to their earnings. For example, the Invesco Solar ETF (a basket of solar stocks) is richly valued and carries a forward PE ratio of 100 😱.
Canadian Solar has been able to vertically integrate and expand the product lineup to incorporate PV modules (solar panels), inverters (devices that convert the sun's energy into usable grid electricity), and energy storage solutions (large batteries for companies and electrical grids). These products in addition to the project development division of the business ensure that they can cut costs and increase margins as they expand.
Canadian Solar is also diversified across geographies - earning balanced revenues across the major markets of the Americas, Europe, and Asia. This reduces risk as seen in some more market-concentrated firms in the solar industry.
This diversification will help the company shrug off regional instability as it seeks to capture a piece of the huge and fast-growing global solar market. The market was valued at $52.5 billion in 2018 and is projected to reach $223.3 billion by 2026, growing at an annualized rate of 20.5% from 2019 to 2026.
Microsoft (NASDAQ: MSFT)
Why are we advocating for a trillion-plus dollar ‘mega tech’ firm in our list of energy transition investment picks? Glad you asked. We are deeply impressed with the contribution that Microsoft is making to the transition through the decarbonization of its operations and industry leadership. The company is setting new standards for decarbonization and helping other companies by creating a world of shared metrics and data.
Microsoft is the first company to commit to not just achieving ‘net-zero’ emissions, but to become ‘carbon negative’ by removing from the atmosphere all emissions generated by the company and its suppliers since its founding in 1975.
What this means is that the company plans to become carbon neutral by 2030, but not stop there. The roadmap calls for the company to continue to actively remove greenhouse gasses from the atmosphere until 2050 when the company projects to have removed the equivalent to all emissions produced since the founding of the company in 1975. In short, this is a big deal.
But of course, we are not talking about an atmospheric carbon removal company. We are talking about a software business worth $1.8 trillion that is compounding annually at 18% and contains brands such as Windows, Xbox, and Azure. The cloud computing division alone is growing at approximately 50% annually and is nipping at the heels of market leader Amazon Web Services.
The company has had significant tailwinds during the pandemic as it is powering the digital transformation of companies and allowing workers to be productive from anywhere with products like Azure, Sharepoint, and Teams. The network effects of these products have made their adoption a no-brainer for many companies.
Over the last five years, the company has reported average gross margins of 66% and has been able to sustain growth without compromising the balance sheet. In addition, Microsoft pays a dividend yield of about 1% and has consistently beaten revenue and profit guidance.
—
At SAIP, we're happy to help but you should not be blindly reading this and then sinking your life savings into these stocks. 😀 As with all investment decisions, each individual should undertake their own research and ensure that they are in a good financial position before investing in the stock market.
We would love to hear from you and your thoughts on these picks. Please reply to this email or comment on the post with any comments or questions. Next week, we will continue the series with a discussion on three more companies that are a part of the SAIP portfolio and facilitating the energy transition.
The data 📈
For this newsletter, we used two different datasets for two different charts. For the Texas Grid Energy Mix, we charted the total GWh for 2020 broken down by energy type. The dataset is from Ercot. For the Growth since stock purchase, we used Google Finance data for each stock since the date we bought the stock until Jan 31, 2020. We visualized the data by using a one-week moving average of the total daily percent change for each holding. The percent change from stock purchase to Jan 31, 2020 is based on the one-week moving average not the % change from stock purchase to Jan. 31, 2020.