
Energy Transition Holdings Part II 🐂
How can I build wealth while participating in the transition? ⚡️📈

Dear Partners,
2021 marks an important opportunity for the world in the fight against climate change. The United Kingdom and Prime Minister Johnston (aka BoJo) will host the United Nations Climate Change Conference (COP26) in November.
This conference is significant because it marks five years since the historic Paris Climate Accord (COP21), during which 196 countries negotiated and adopted climate targets. The goal of the agreement is to limit planet-warming greenhouse gas emissions to keep temperature rise below 2 °C (3.6 °F) above pre-industrial levels and to pursue efforts to limit the increase to 1.5 °C (either of these temperature increases will not be great for the inhabitants of planet earth 🔥🌎🔥).
Since we are coming up to an opportunity for countries to get together and bang out an important deal to reduce global emissions, we thought we would investigate how a selection of nations are getting on with their goals.
The Climate Action Tracker has created a comprehensive dataset on country-specific emissions reduction pledges. In graphic below, you can see that the biggest emitters (largest bubbles) are predominantly to the right of the graph (bad).
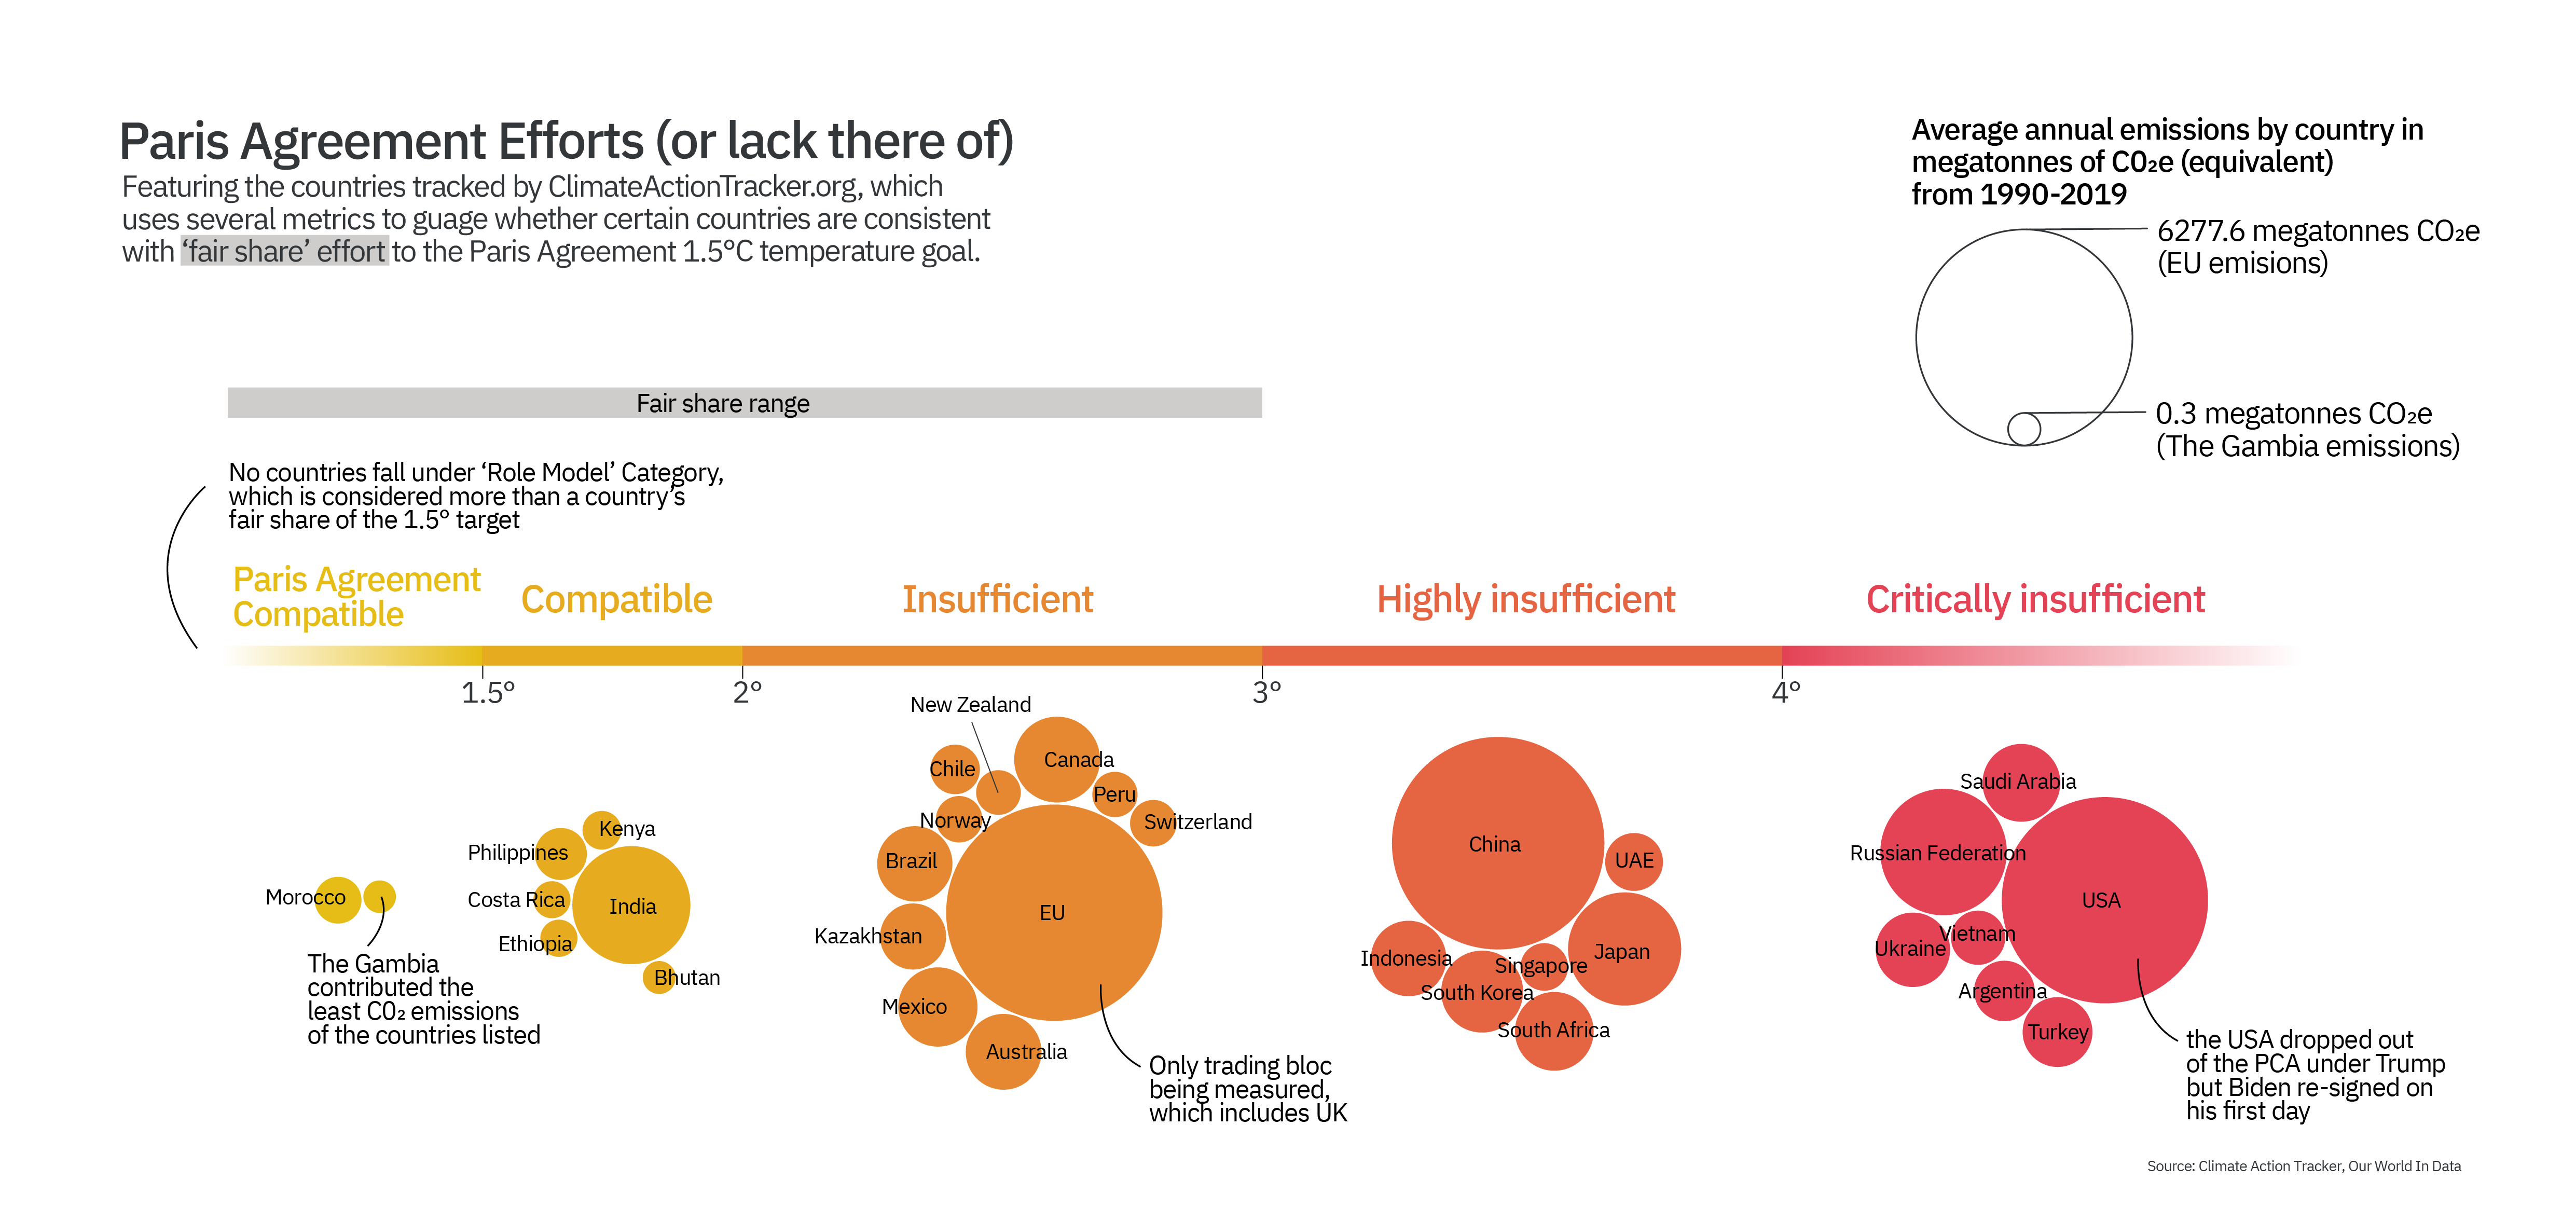
What is painfully obvious is the countries that have contributed the highest average annual C02e emissions to the atmosphere since 1990 are putting insufficient effort toward meeting their Paris agreement targets.
Among the most ambitious countries, it has become common to adopt ‘net-zero’ emissions targets. The EU, along with the UK, Japan, South Korea and others have some form of net-zero target by the middle of the century. These targets commit a country to remove as much carbon from the atmosphere as they add. Getting to net-zero will require aggressive emissions reductions across economies in combination with reforestation and carbon-capture technologies.
Some countries with net-zero targets, including Japan and South Korea, are highlighted above as performing highly insufficiently, while the EU (including the UK…for now) is performing insufficiently but still contributing their fair share towards their pledge. Here’s to hoping they step-up their game and unleash their combined economic and innovative powers to solve this problem.
Now that we’ve gotten through the depressing part, onto the good stuff. For those of us without oodles of free time, how can we contribute to the energy transition while also building wealth? Let’s dig into how investors can position for a net-zero future. Here are a couple more companies that we feel are doing the right thing and that we also invest in.
Berkshire Hathaway (NYSE: BRK.B)
Warren Buffett is the GOAT (greatest of all time) of investing, everyone knows it. The master has returned an average of 20% compounding annually since the inception of Berkshire Hathaway, and $10,000 invested in 1964 would now be worth almost $300 million.
Omaha, Nebraska based Berkshire Hathaway has evolved from a bankrupt textile business — when Buffett took over in 1964 — to its current form as the eighth largest public company in the world and conglomerate of diversified operating businesses and investment holdings. The business and its celebrity managers — Buffett and right-hand-man Charlie Munger — have become heroes in the investing community due to their principled business dealings, deep wisdom, and amazing long-term success.
How will the Oracle of Omaha and his conglomerate brainchild help you invest in the energy transition? Glad you asked. The company is among the largest power producers and utility operators in North America with 11.8 million customers and projects operating in solar, hydro, wind and geothermal generation.
In addition, Buffett has made some very interesting investments in other cleantech companies such as Chinese electric vehicle manufacturer BYD and is building the largest solar farm in the United States near Las Vegas.
Financially, the company is famously stable and reaps over $254 billion in annual revenues from a huge array of diversified operations including insurance, financials, technology, consumer products, restaurants and more. This is a great way to diversify your portfolio while only owning a single stock!
In addition, the company is sitting on a mountain of cash (almost $150 billion) and has been repurchasing shares over the previous year — a good sign. Buffett, famously a value investor, has historically made the decision to repurchase his own shares during periods in which he believes them to be trading at a discount to ‘intrinsic value’ (what he calculates the business to be worth). The fact that he is doing this now gives us a warm tingly feeling.
Proterra (NASDAQ: ACTC)
For those that are interested in the future of electric vehicles but don’t know where to start, this is a great place. Proterra is a North American manufacturer of electric busses and powertrains for commercial vehicles. The company also provides the charging infrastructure required by operators of these vehicles.
According to the United Nations, air pollution contributes to approximately 7 million premature deaths per year. These impacts are felt most acutely by those living in large urban areas. As countries struggle to reduce emissions and improve the living conditions for their citizens, cities around the world are introducing ever stricter emissions requirements and pollution controls. As urban populations continue to expand, the race to cut emissions and reduce urban pollution will continue to accelerate — this is where Proterra comes in.
Proterra is serving the global commercial vehicle market — worth about $260 billion globally. Within this market, the electric bus segment is expected to experience annual growth of 25% between 2019 and 2025, with the North American market projected to exceed this at an average growth of 50%.
Driving this growth is the aforementioned environmental and public health benefits, along with the substantial cost savings that are made possible via the adoption of electric busses. According to Proterra, electric busses result in a 40% reduction in total operating costs versus diesel-powered busses. This is the result of far lower fuel costs (often upward of 80%) along with minimal required maintenance and long lifespans for the vehicles.
Great, so the market is compelling but what about Proterra’s products? Well, unlike many newly public and overhyped EV companies, Proterra has an impressive 10-year track record with over 16 million real-world miles driven.
In our view, Proterra’s customer relationships and $193 million of 2020 revenue dramatically reduce the execution risk versus several of their no-revenue competitors (Arrival, Nikola, Hyliion).
Now, the company is not yet trading under the name Proterra. This is due to the type of deal taking the company to public markets. This process will involve a publicly-traded ‘blank-check’ company (ArcLight Clean Transition Corp) merging with Proterra to create a publicly-listed entity.
This type of deal is called a Special Purpose Acquisition Company (SPAC) transaction. 2020 saw an explosion of SPAC deals taking place in the USA, with the structure becoming a very popular alternative to the traditional Initial Public Offering (IPO). The trend looks set to continue, so if you are interested in learning more about what SPACs are and how they work click the link here.
Renewable Energy Group Inc. (NASDAQ: REGI)
While the energy transition is the process of moving toward more efficient technologies to decarbonise the global economy, there are some sectors that are very difficult to move away from fossil and liquid fuels.
However, there are companies working on reducing the carbon intensity of fuels and creating sustainable options for industries like heavy transportation and aviation which are more difficult to decarbonise. This is where Renewable Energy Group (REG) comes into the picture.
REG is a US-based business that supplies renewable fuels for heating, transportation, power generation, and industrial uses. These fuels include biodiesel and renewable diesel which are made from waste fats and oils. Keeping it to a high-level explanation, biodiesel is made through a chemical process called transesterification in which those oils or fats are converted to what are known as fatty acid methyl esters (FAME), which is the chemical name for biodiesel.
These fuels have dramatically lower lifecycle emissions than traditional fossil fuels, often approaching 80% lower emissions. At current sales volumes, REG products are responsible for about 4 million metric tons of carbon reduction each year compared to traditional fuels (equivalent to the emissions from 2.3 million barrels of oil).
In addition to playing a constructive role in the energy transition, the business is also growing rapidly and displaying impressive financials. At $2.1 billion in annual revenues, the company has been growing the top line at more than 50% per year, and has reported earnings (EBITDA) of $195 million for 2020. Balance sheet improvements have also been made at the company as they have paid down debt with free cash over the past year.
Even after a big run-up in 2020, the stock is trading at an attractive forward price-to-earnings ratio of 20, compared to the US market average (S&P500) of 39.
Our view is that continued adoption of carbon emissions controls and regulations in the US and Europe will continue to boost the bottom line of REG and make low carbon fuels much more attractive to customers over the long term as the energy transition continues to scale.
—
At SAIP, we're happy to help but you should not be blindly reading this and then sinking your life savings into these stocks. 😀 As with all investment decisions, each individual should undertake their own research and ensure that they are in a good financial position before investing in the stock market.
We would love to hear from you and your thoughts on these picks. Please reply to this email or comment on the post with any comments or questions. In the next SAIP newsletter, we will be taking a break from the Energy Transition⚡️ and delving into Fintech revolution💸.
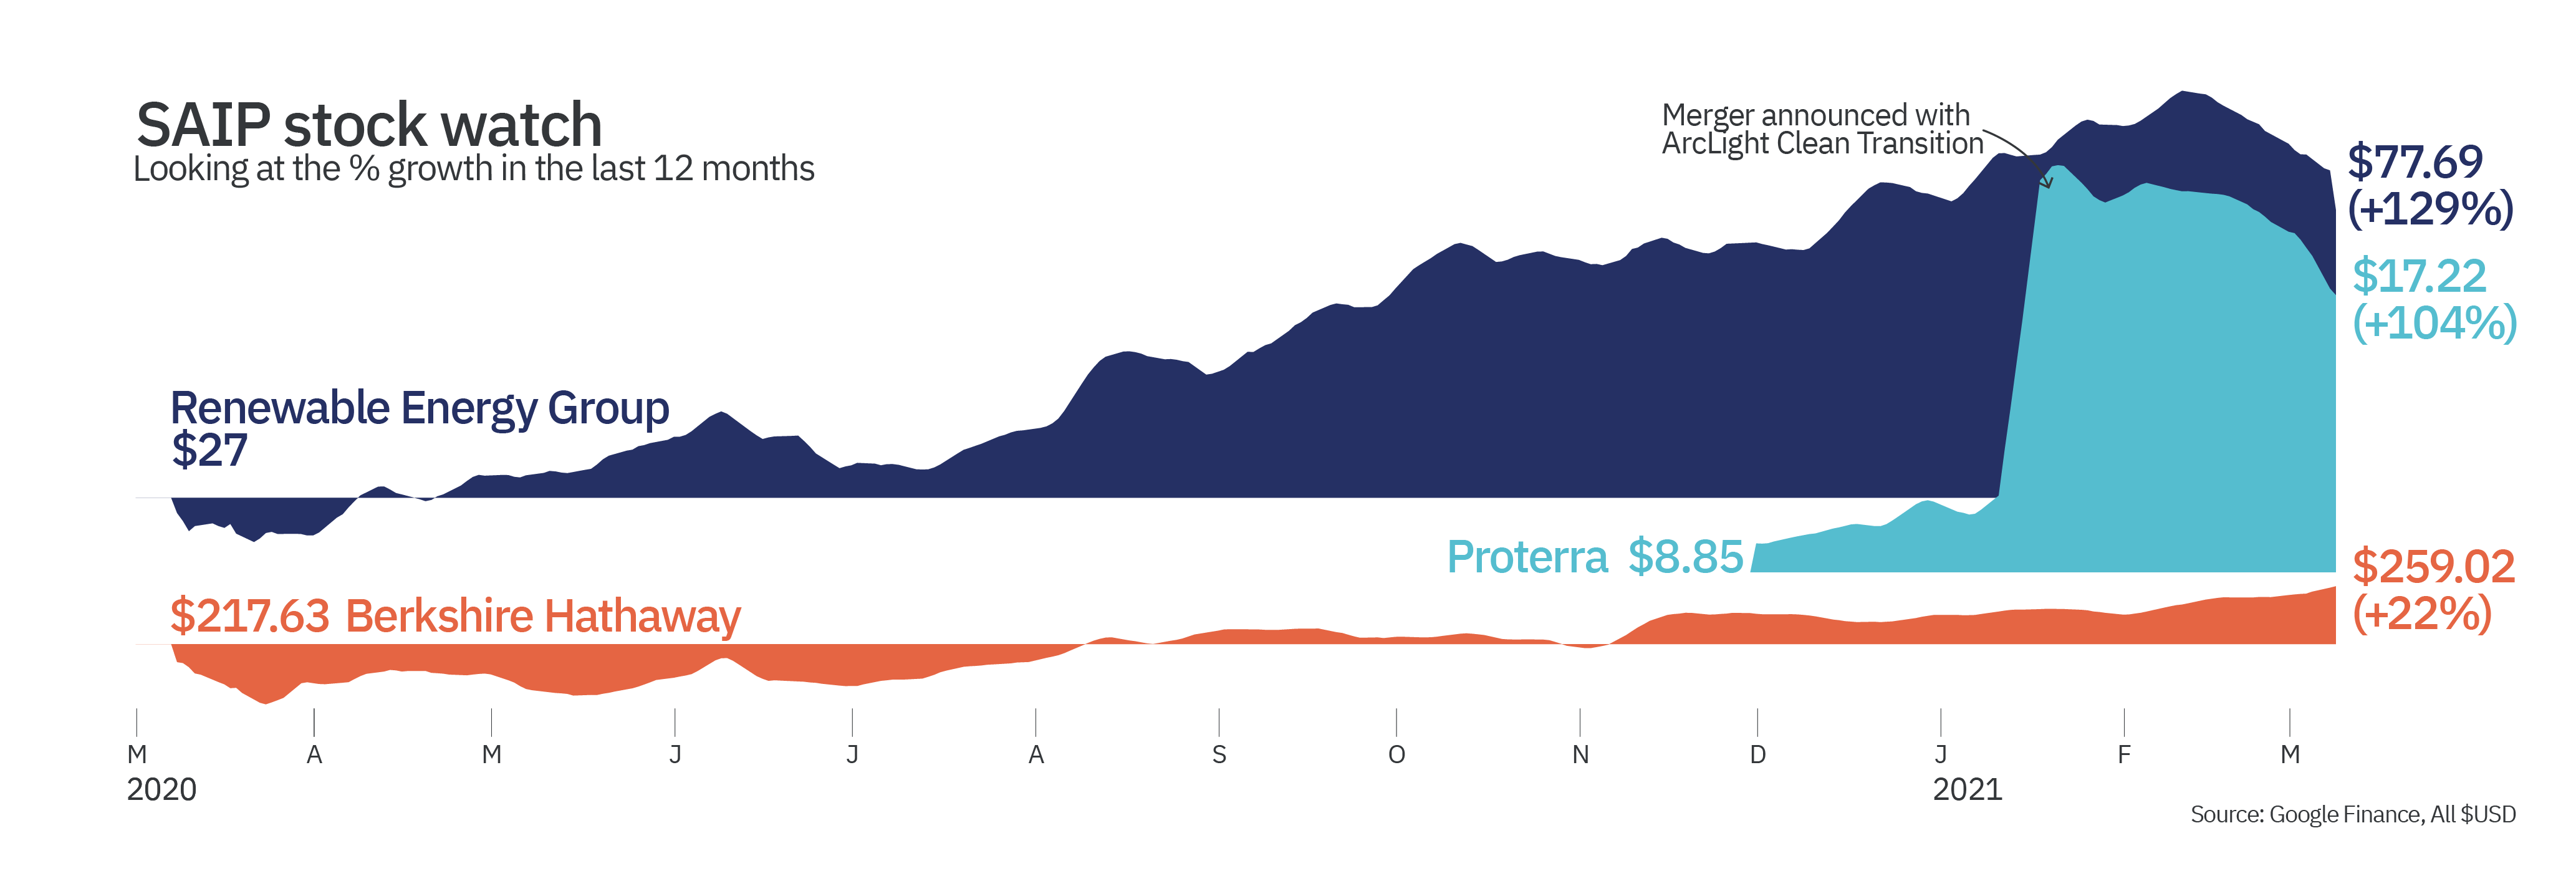
The data 📈
For this newsletter, we used three different datasets for two different charts. For the Paris Agreement Effort graph, we used the climateactiontracker.org Countries Overview. If you’re interested, you can find more detail on their Rating System and see how each country is doing in detail on the tracker. We also used Our World In Data’s CO2 emissions dataset. We isolated the countries from the Climate Action Tracker and found the average annual emissions from 1990-2019. For the SAIP Stock Watch, we used Google Finance data for each stock from March 3, 2020 to March 9, 2021. We visualized the data by using a one-week moving average of the running total daily percent change for each holding. The percent change from March 3, 2020 to March 9, 2021 is based on the one-week moving average not the % change from stock price on March 3, 2020. If you have any questions or need any clarification on our data calculations or visualizations, please reply to this email or comment on the post.